
An engineering manager is asked "are we on track?" constantly, and "I think so" is not an answer. PlanMagnet turns the work into metrics.
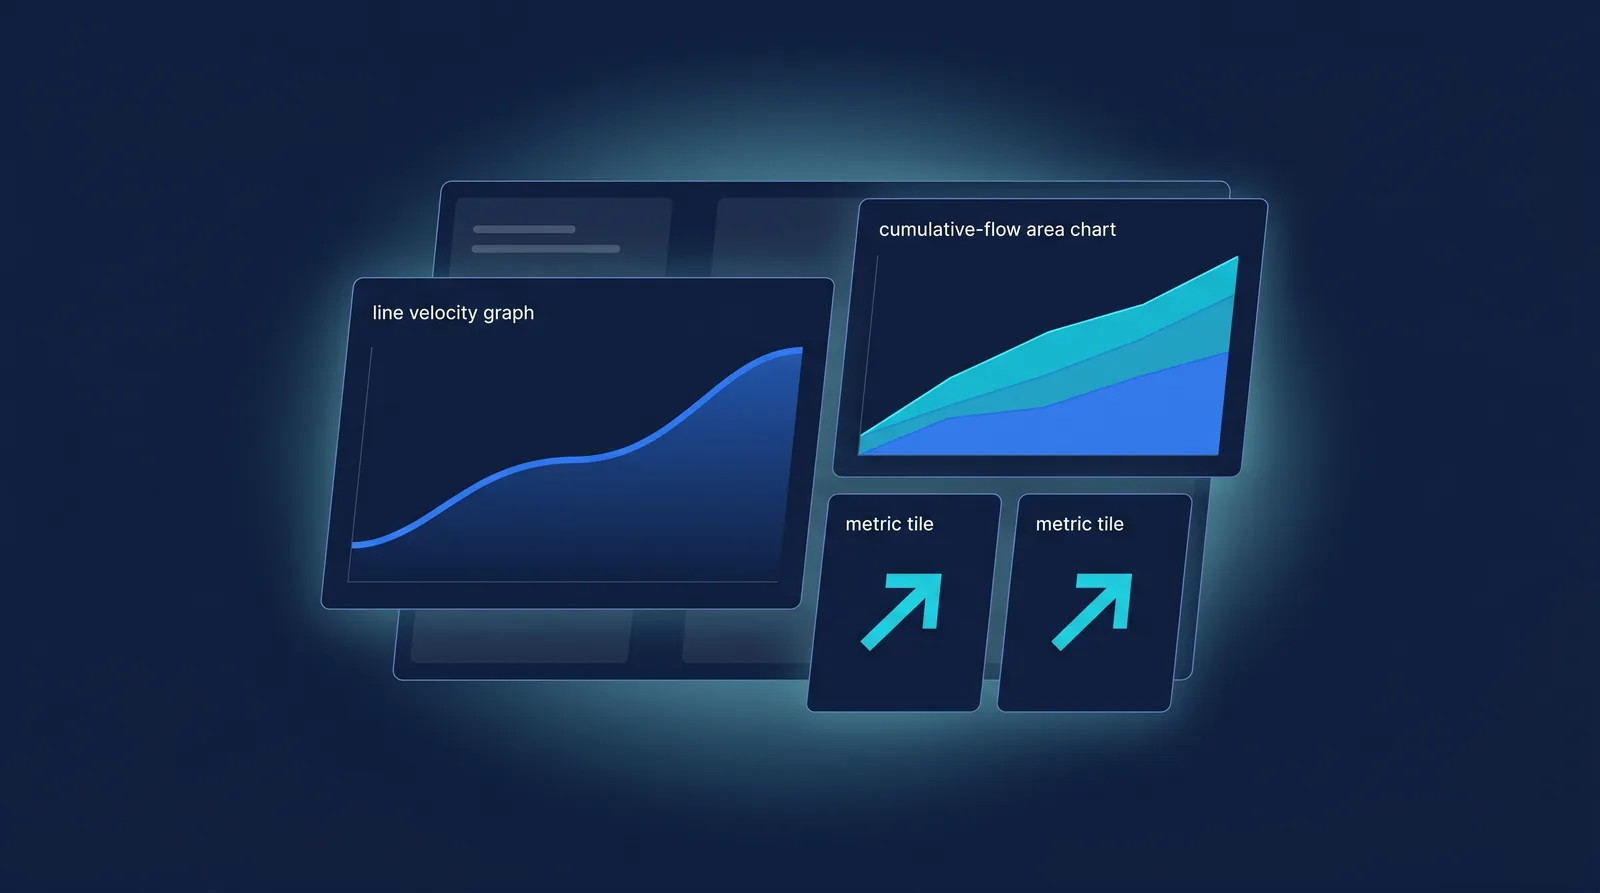
Live dashboards show velocity, cycle time, throughput, and cumulative flow, drawn from the team’s actual items rather than a separate spreadsheet. A widening cycle time flags a bottleneck before it becomes a missed quarter; a steady velocity makes a forecast credible.
Because the data is the work, there is no reconciliation step — the report is always current.
Illustrative scenario describing the analytics the platform is being built to deliver, not real metrics.
Illustrative planning guide
Build live delivery dashboards from your real work data, drill into the items behind a number, and run delivery on evidence.
Open the Analytics page to see delivery metrics drawn from your work.
You should see: Velocity, cycle time, and throughput render from real items, not a spreadsheet.
Ready to make this your story?