
Scheduled Reports
Configure recurring delivery reports by type, project and schedule, and see how many are scheduled or have run today.
These images are illustrations of the concept, not screenshots of the actual product.
Overview
Scheduled Reports is the reporting layer of the PlanMagnet concept: a place to set up delivery reports once and have them produced on a schedule, instead of assembling the same numbers by hand before every review. It belongs to the Delivery Insights area alongside the dashboard and analytics views and is reached from the Reports entry in the main sidebar.
Status reporting easily becomes a recurring chore. Someone exports data from the tracker, rebuilds a velocity chart, pastes it into a document and sends it round, and by the time it lands the numbers are already out of date. A report defined once, with its type, scope and cadence, is designed to replace that routine with something that runs on its own.
The two illustrations show the list and create views. The Reports page counts configured reports and summarizes them in three cards: total reports, how many are scheduled and how many ran today. A filter row and a New Report button sit above the list, which in this illustration shows its empty state with a chart icon and a short message. The Create Report form, introduced as a way to configure a new automated report, asks for a report name, a description of what the report tracks, a report type such as velocity, an optional project that defaults to all projects and a schedule such as weekly.
Because a report can cover one project or every project, the same setup is designed to serve both a team lead following a single team's sprint cadence and a delivery head watching the whole portfolio. Reports are meant to draw on the same work that fills the task board, sprints and dashboard, so the figures reflect the work itself rather than a separate copy kept in sync by hand.
What this concept shows
- A Reports list with summary cards for total reports, scheduled reports and reports run today
- A New Report action and a filter row above the report list
- A clear empty state when no reports match the selected filter
- A Create Report form for configuring an automated report with a name and a description of what it tracks
- Report types such as velocity, chosen from a dropdown
- An optional project scope that defaults to all projects
- A recurring schedule, such as weekly, set for each report
How it works
- Open Reports from the main sidebar to see how many reports exist, how many are scheduled and how many ran today.
- Choose New Report to open the Create Report form.
- Name the report and describe what it tracks.
- Pick a report type, optionally limit it to one project, and set a schedule.
- Create the report and return to the Reports list to review it alongside the others.
Who it's for
- Delivery and program managers
- Engineering managers
- Team leads and scrum masters
- Executives and stakeholders who receive regular status updates
Illustrations
2 illustrations of this concept. Select one to view it full size.
Reports List
The Reports page is the home of automated reporting in the PlanMagnet concept, with Reports highlighted in the main sidebar. Under the heading, a line counts how many reports are configured, and a New Report button sits at the top right. Three summary cards follow: total reports, scheduled reports and reports run today, all reading zero in this illustration. A single All filter chip sits above the list area, which shows an empty state made of a bar-chart icon and a message that no reports were found for the selected filter. The layout puts the at-a-glance questions first: how many reports exist, how many run on a schedule and whether today's have gone out. The top bar, breadcrumb and footer match the rest of the product.
Create Report Configuration
This illustration shows the Create Report form, introduced as configuring a new automated report. A Report Configuration card holds a Report Name field with a sprint velocity report as example placeholder text and a Description area that asks what the report tracks. Below them, three dropdowns sit in a row: Type, set to velocity; Project, marked optional and set to all projects; and Schedule, set to weekly. Cancel and Create Report buttons sit above the card. The form demonstrates how compact the design keeps report setup: a report's content, scope and cadence are each a single choice, so a recurring weekly velocity summary covering every project can be defined from a handful of fields. The breadcrumb places the page under Reports.
Topics
- scheduled reports
- automated project reports
- sprint velocity report
- weekly status report
- delivery reporting
- agile reporting tool
- recurring reports
- project portfolio reporting
- engineering metrics reports
Related concepts
Dashboard, Delivery Analytics and Forecasting
One place to open the day: a delivery dashboard, project health metrics, and an AI-assisted forecast of when work lands.
3 illustrations
Sprint Planning and At-Risk Sweeps
Start sprints, review planning sessions across projects, and get a daily sweep that flags at-risk work with a stated reason.
3 illustrations
Project Portfolio and Milestones
A portfolio view that runs from every project, to the ones in flight, to the milestones they are judged by — plus a form to start the next.
4 illustrations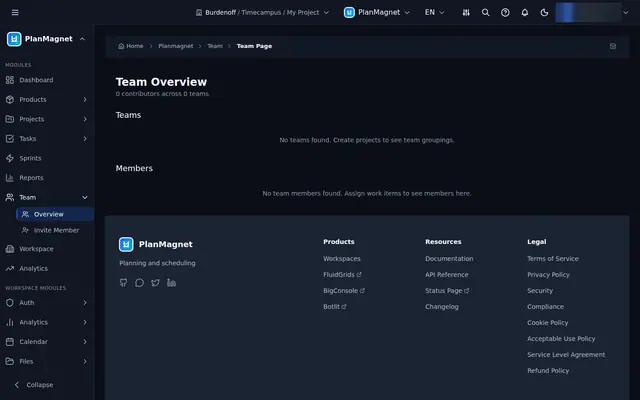
Team Overview and Invitations
See who is contributing and how they group into teams, then invite a colleague with a role, department and team in one short form.
2 illustrations